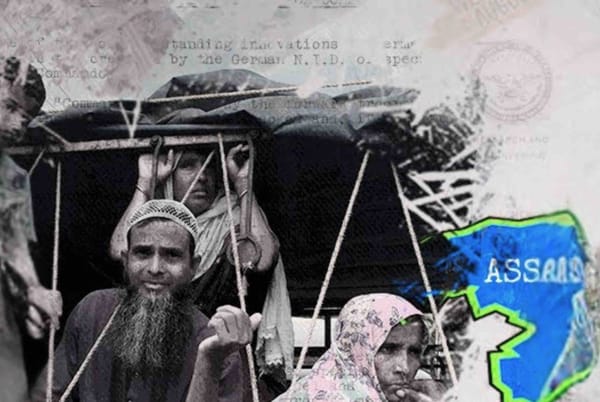
Who Are Assam's Muslims? What the data says before polling day
On 9 April, over a crore Muslim voters will cast their ballots in Assam. For decades, narratives around their numbers have shaped how they are seen, policed, and governed. This article examines the data behind these claims and explains what it actually tells us about Assam’s Muslims.

Every election cycle in Assam arrives with a familiar freight. Allegations of illegal immigration. Warnings of demographic change. Questions — rarely asked with any precision - about who really belongs here. By the time booths open on 9 April, these narratives will have already done their work: shaping who is treated as a suspect voter, which communities are mobilised on fear, and which legitimate grievances get buried under identity politics.
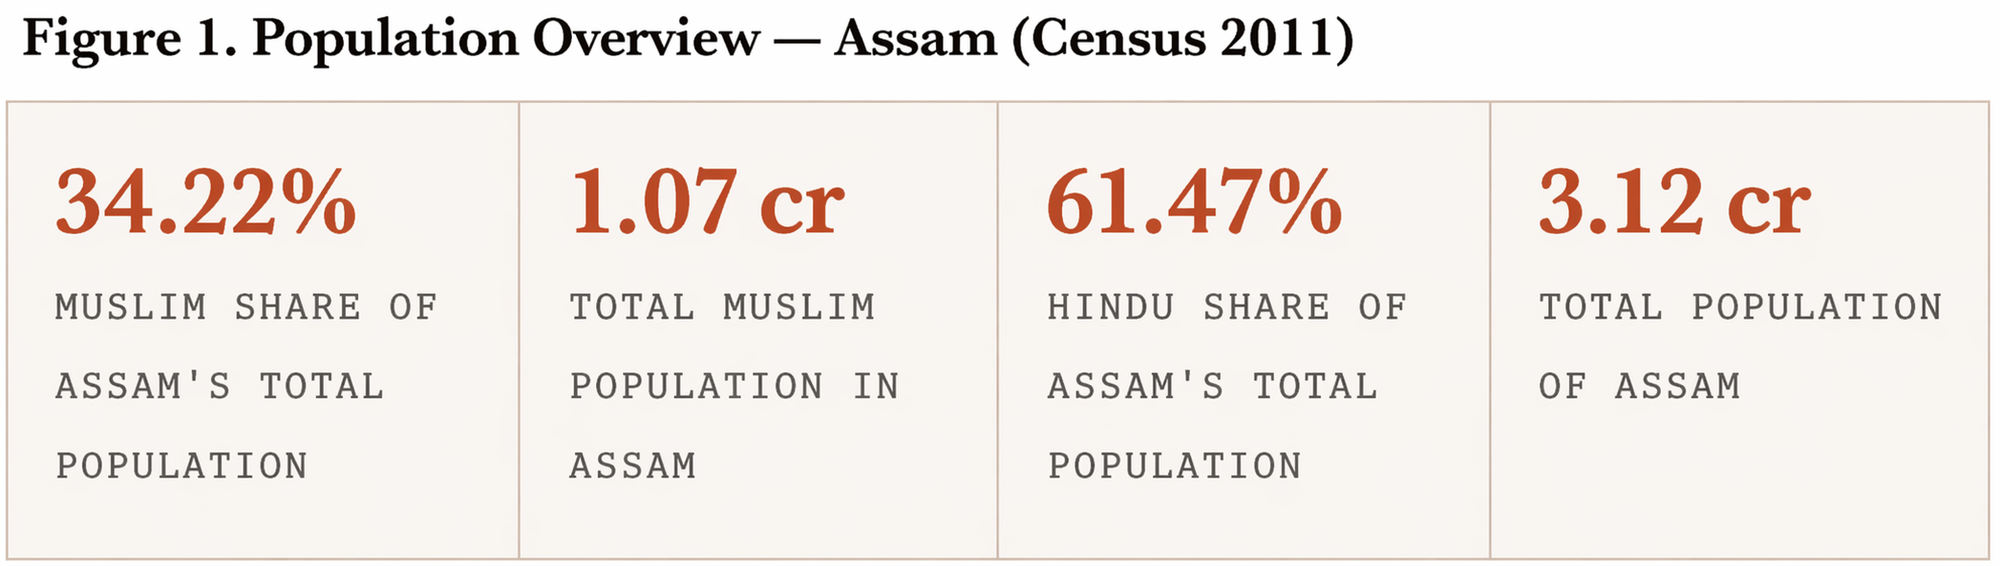
Assam’s Muslims constitute 34.22% of the state’s population - more than one in three residents. They are not a fringe constituency. Yet, election after election, their demographic story is told less through data and more through anxiety.
Drawing on a century of census data, multiple rounds of the National Family Health Survey, and district-level research, this article examines who Assam’s Muslims are, where they live, and how their demographic profile has evolved. The evidence does not support claims of a “demographic threat.” Instead, it points to a community shaped by structural disadvantage and ecological vulnerability, while being persistently framed through the lens of political anxiety.
For a deeper historical context of Muslim presence in Assam, you can read our earlier article here.
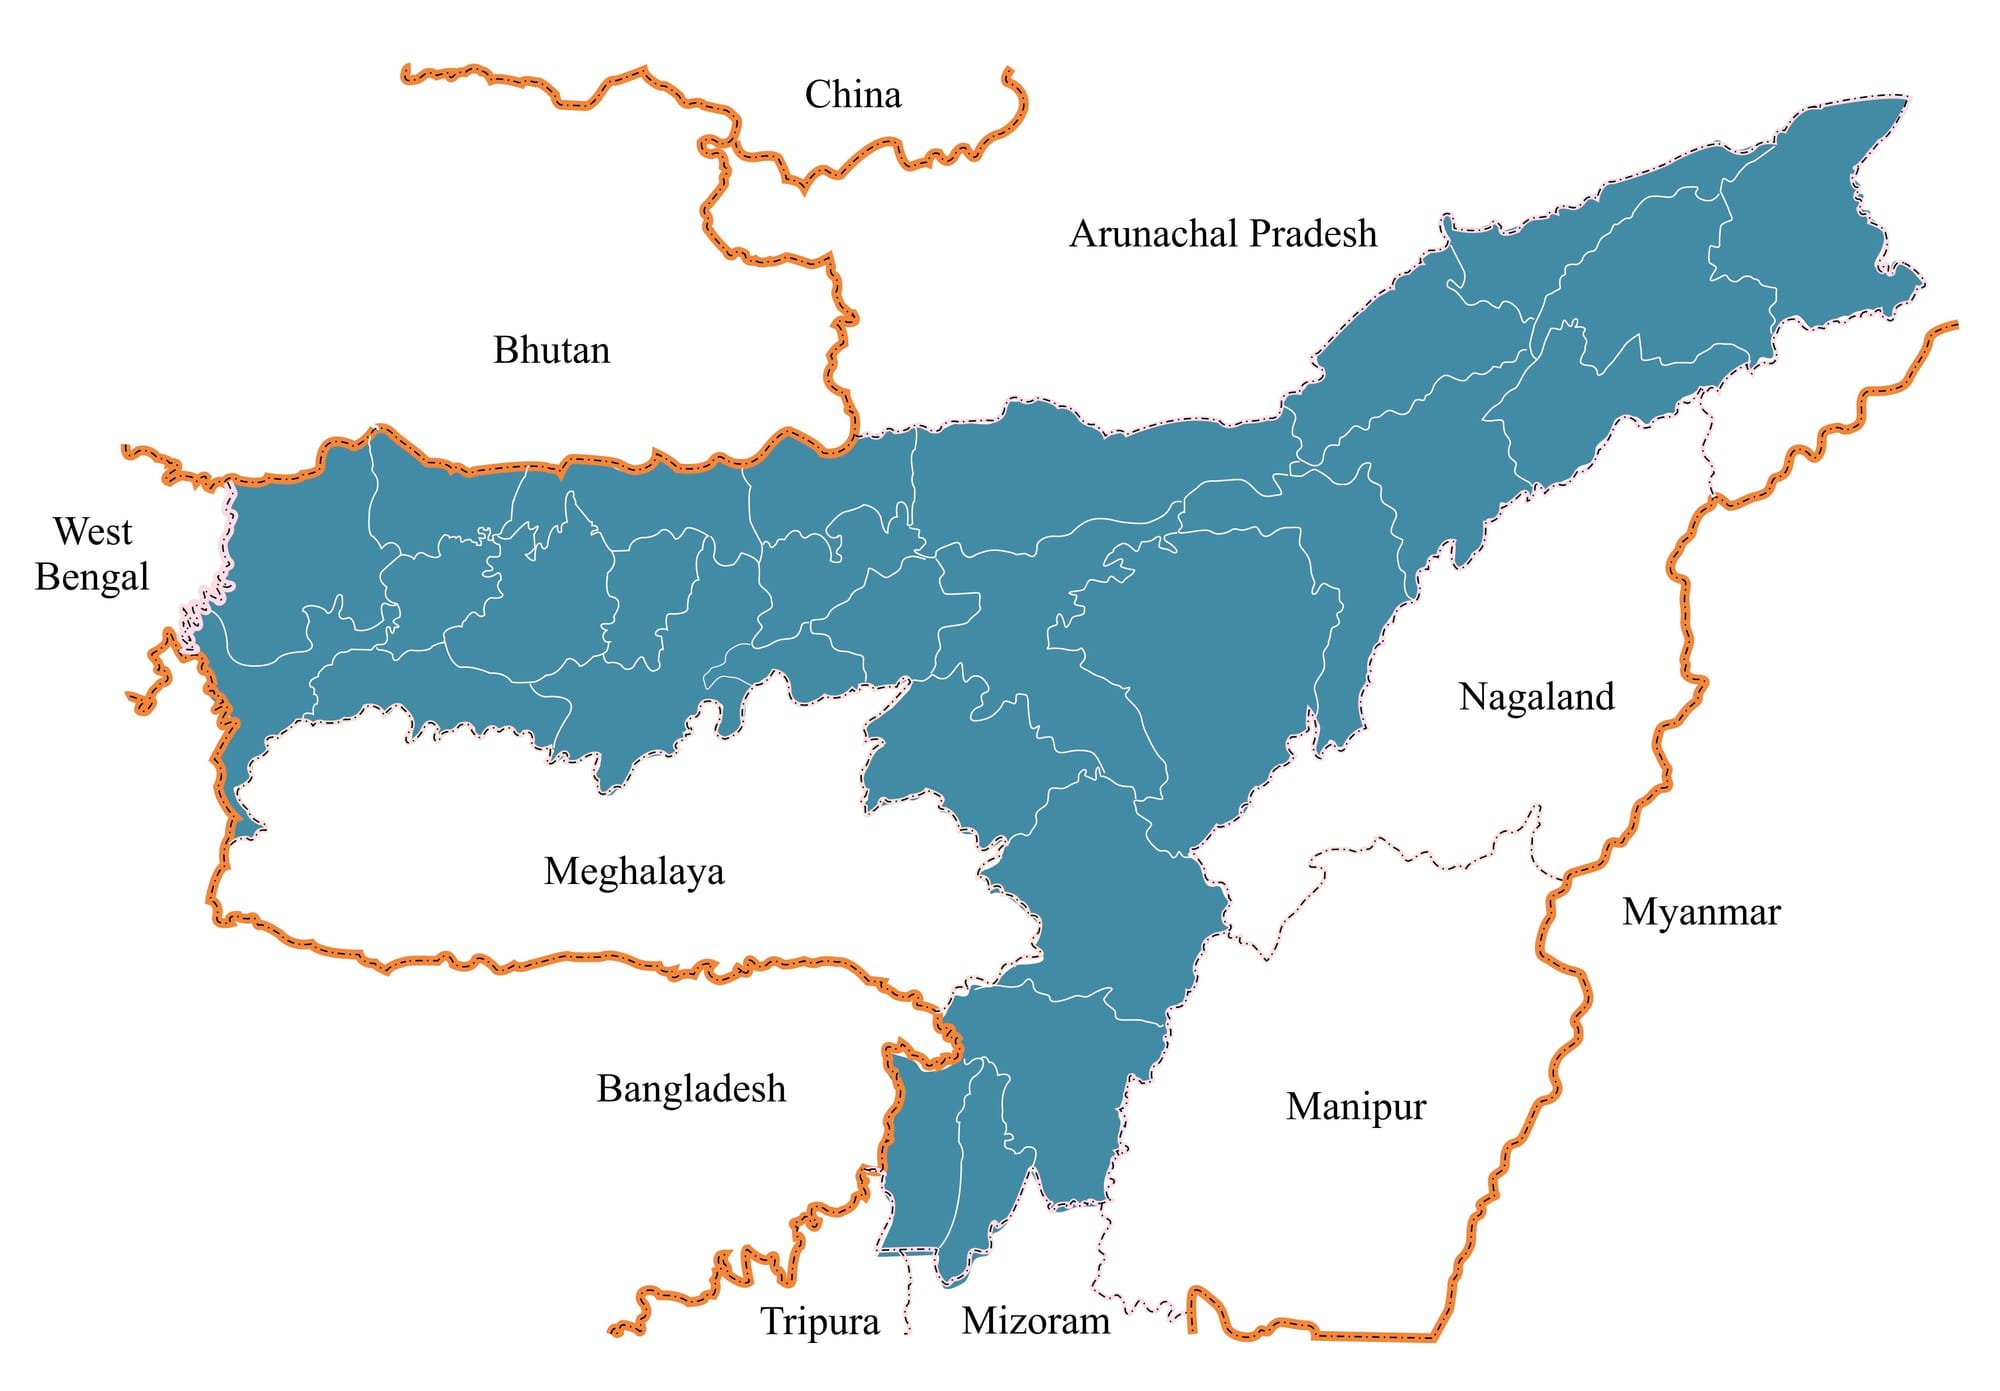
Assam occupies an exceptional position in India's political geography. One of 35 states and union territories, it covers 78,438 square kilometres - just 2.4% of India's land area - yet sits at the intersection of seven Indian states and two neighbouring countries, Bhutan and Bangladesh. Its 3.12 crore people are overwhelmingly rural: 98% of its land and 86% of its population live outside cities. This geography, and the migrations and displacements it has witnessed over centuries, is inseparable from any serious understanding of who Assam's Muslims are, and why the debates around them so often generate more heat than light.
Population Size and Growth Trends
According to the Census of India 2011, Muslims constitute 34.22% of Assam's population, approximately 1.07 crore people, making it the largest Muslim-concentrated state among India's major states. That number invites political scrutiny. But scrutiny requires context, and the context here runs deeper than most debates acknowledge.
Historical Trends: A Century of Census Data
The demographic trajectory of both Muslims and Hindus in Assam is considerably more complex than the oversimplified narratives that often circulate in political discourse. A close reading of census data from 1901 to 2011 (Table 1; Table 2; Figure 2; Figure 3) reveals that shifts in population shares are shaped not by religious doctrine or “demographic competition,” but by a wide range of social, economic, political, and ecological factors.
Table 1: Muslim-Hindu Population in Assam (Census 1901-2011)
Source: CPS India
(Note: The 1981 Census could not be conducted in Assam because of the Assam agitation.)
- The Misread Interval: 1971–1991
A particularly misunderstood period in Assam's demographic history is the 1971–1991 interval. During this span, the Hindu population share declined by 5.37%, while the Muslim share increased by 3.87%. These figures are routinely highlighted to suggest an abnormal shift in favour of Muslims. But two crucial facts undermine that reading.
First: The 1981 Census was not conducted in Assam due to the Assam Movement. The change recorded in 1991 therefore represents a cumulative shift over twenty years — not a single decade. Any comparison that ignores this extended interval will inevitably misrepresent the pace and scale of demographic change.
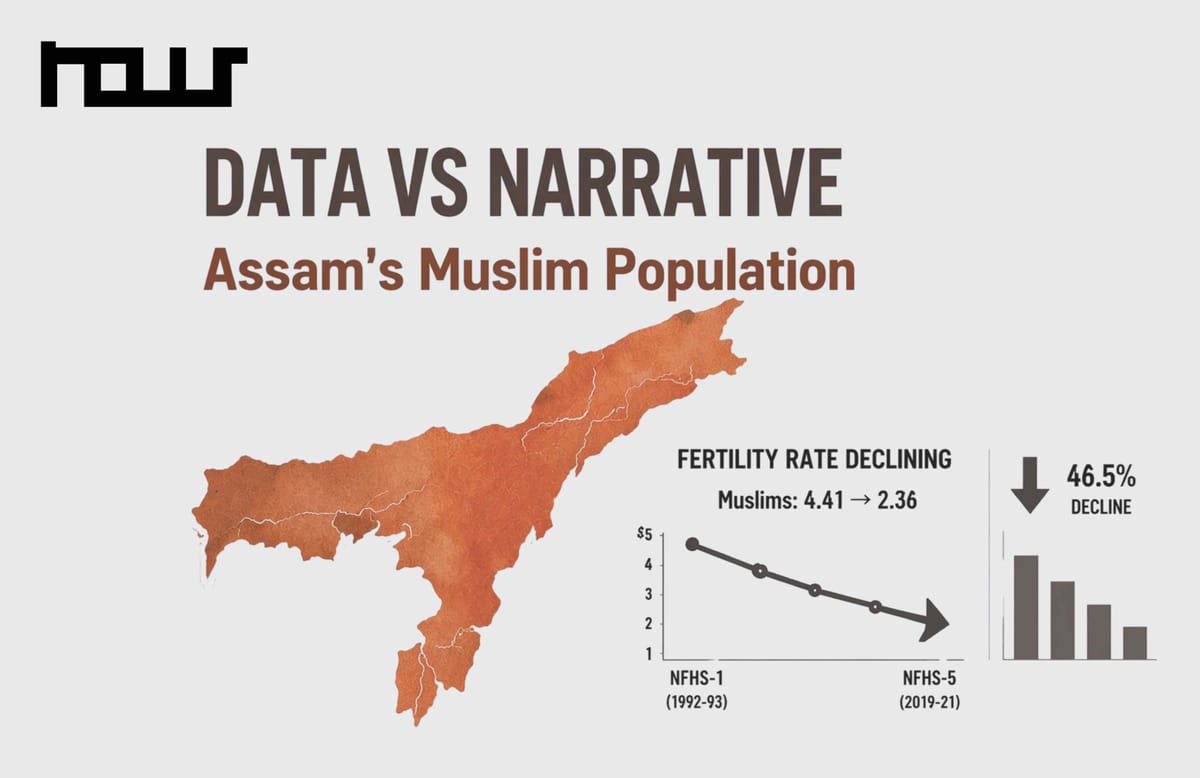
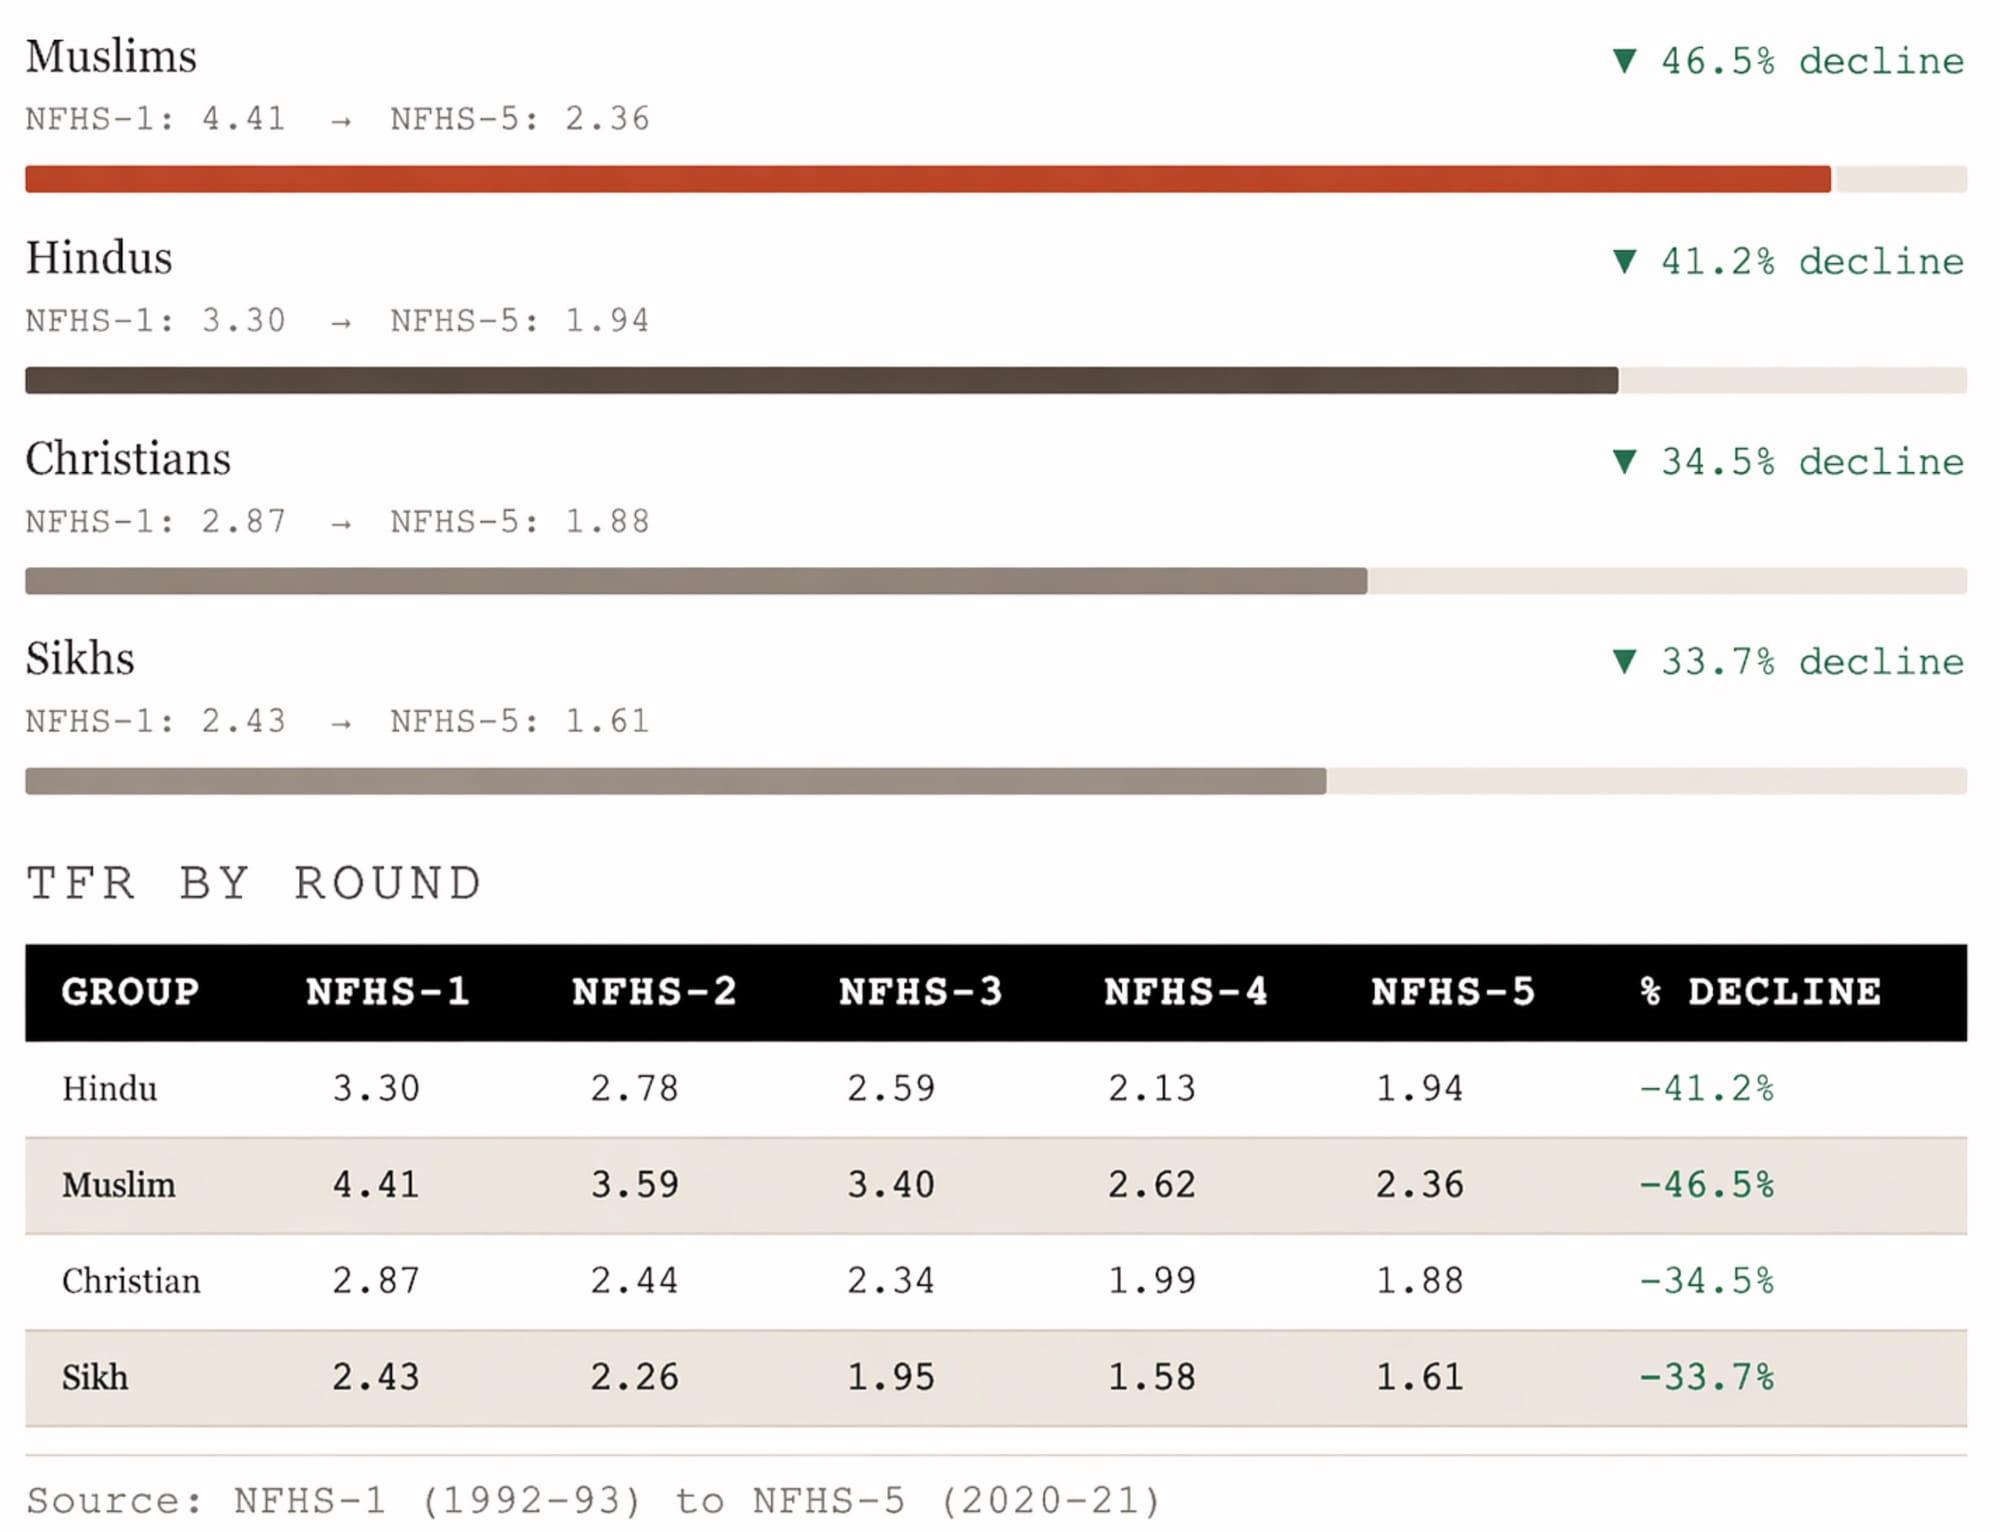
Second, it is true that the Muslim population share grew more than the Hindu population share over this twenty-year period. One important contributor to this differential was the higher Total Fertility Rate (TFR) among Muslims. According to NFHS-1 (1992–93), the TFR among Muslims in Assam was 4.41, compared to 3.30 among Hindus (Fig. 2). In demographic accounting, such fertility differentials naturally produce divergent growth rates - especially when observed across a two-decade interval.
Figure 3: Total Fertility Rate (TFR) in Assam — Decline by Religious Group (NFHS-1 to NFHS-5)
However, the absolute growth rates during 1971–1991 complicate simple attributions. While Muslims in Assam registered a growth rate of 77.42% over this period, Scheduled Castes grew by 81.84% and Scheduled Tribes by 78.91%. Rapid population growth was not exclusive to Muslims - it occurred across multiple socially and economically marginalised groups. These patterns indicate that rapid population growth was not exclusive to Muslims; rather, it occurred across multiple socially and economically marginalised groups. The comparatively high growth among SC and ST populations - communities with no direct religious linkage to Islam - strengthens the inference that structural deprivation and socio-economic disadvantage underpinned the observed demographic patterns.
Further, when Assam’s population growth is placed in comparative perspective, the claim of “abnormal” Muslim growth becomes untenable. Between 1971 and 1991, the all-India Muslim population grew by 71.47 percent, only marginally lower than Assam’s 77.42 percent (Table 3). Assam’s trajectory therefore largely mirrors national demographic patterns. Indeed, during the same period, Muslim population growth rates were comparable or even higher in several other states with substantial Muslim populations, including Uttar Pradesh (76.30%), West Bengal (77.32%), Madhya Pradesh (80.76%), Rajasthan (98.29%), Tripura (89%), Punjab (110.32%), and Himachal Pradesh (77.64%). With the exception of Punjab, all these states have historically had sizable Muslim communities, underscoring that Assam is not an outlier.
In this context, Mannan (2017) poses an incisive question:
"If it is assumed that the high growth rate among Muslims in Maharashtra, Punjab and Haryana is due to the migration of Muslim workers from Uttar Pradesh, Bihar, Assam or West Bengal, then how would we explain the high growth rate in Uttar Pradesh, Himachal Pradesh, Madhya Pradesh, Odisha, Rajasthan and West Bengal?"
— MANNAN, INFILTRATION: GENESIS OF ASSAM MOVEMENT (2017)
Mannan's question points to a core analytical principle: demographic change among Muslims across India must be interpreted through the lens of structural socio-economic conditions, not through narratives that attribute growth principally to migration or religious fertility norms.
Table 2: Growth rates of various communities in India from 1971 to 1991 (in %)
Source: Infiltration: Genesis of Assam Movement (Mannan - 2017)
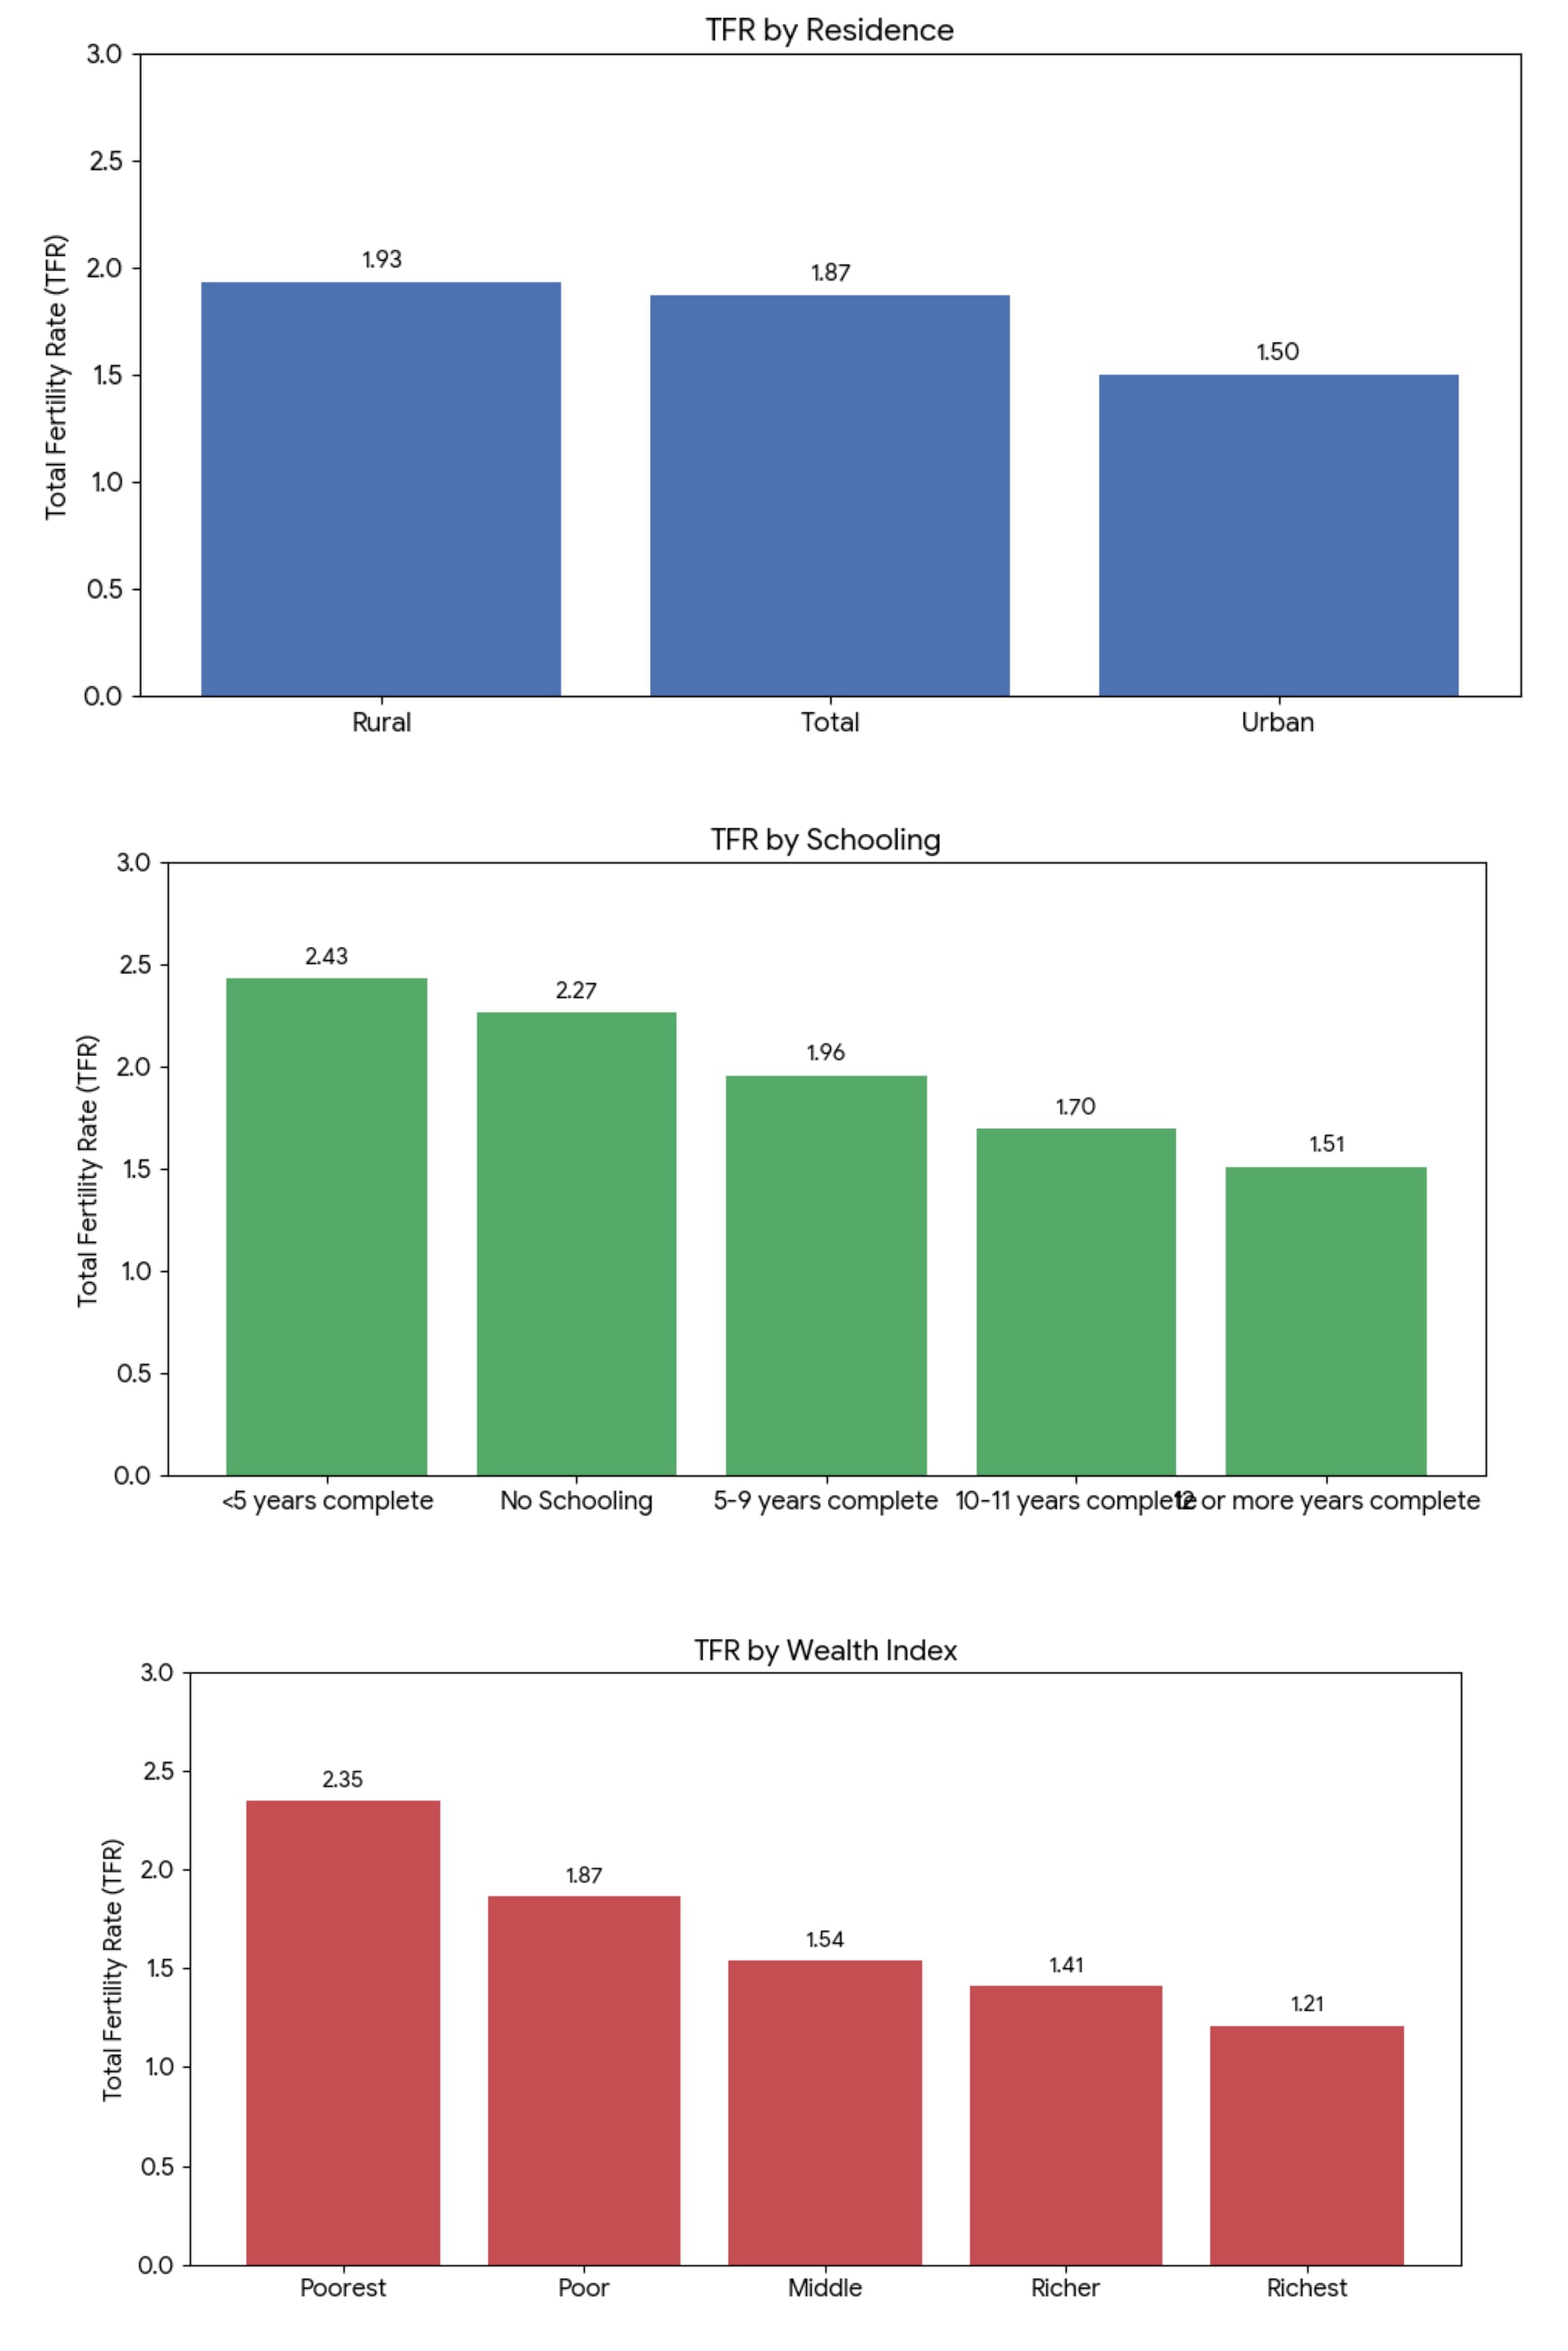
Finally, before attributing higher fertility to religion, it is essential to recognise that fertility behaviour is overwhelmingly shaped by socio-economic conditions - including lower educational attainment, limited access to health and family planning services, and broader poverty (Fig. 3). In Assam, Muslims, particularly those in char (riverine) and other remote rural areas, have historically experienced poorer access to schooling, healthcare, and state provisioning; these structural deficits shaped reproductive behaviour. Importantly, as socio-economic conditions and awareness improved over the subsequent decades, fertility levels among Muslims declined much more rapidly than among Hindus. Between NFHS-1 and NFHS-5, the Muslim TFR fell by - 46.5 percent, compared to a - 41.2 percent decline among Hindus, indicating a sharper pace of reduction. By NFHS-5, fertility rates had moved substantially closer - 2.36 for Muslims and 1.94 for Hindus (Fig. 2) demonstrating a clear trajectory of demographic convergence rather than divergence.
Figure 3: Total Fertility Rate in Assam (Background-wise) - NFHS - 5 (2019-21)
Conclusion
The data and evidence presented above affirm that post-Independence population change in Assam is best understood as part of a normal socio-economic and demographic transition, rather than as evidence of religious expansion or a so-called “demographic threat.” The differing pace of demographic change between Hindus and Muslims is rooted in long-standing structural determinants—such as unequal access to education and healthcare, differential landholding patterns, and the acute environmental vulnerabilities faced by Muslim households residing in the flood- and erosion-prone char areas.
When these deeper, long-term factors are taken into account, it becomes evident that demographic anxieties in Assam are driven less by empirical trends and more by political narratives that selectively amplify population differences. Such narratives routinely overlook the developmental inequalities, historical migration processes, and ecological precarity that have shaped demographic behaviour across communities for more than a century.
Viewed holistically, Assam’s population trends reflect socio-economic conditions and historical processes, not any narrative of religious displacement or demographic imbalance. In particular, the demographic shifts that occurred before Partition (i.e., prior to 1947) played a formative role in shaping Assam’s population structure. These pre-Partition dynamics - including colonial-era migration, agrarian transformations, and administrative policies - will be examined more comprehensively in the next chapter, which situates Assam’s demographic change within its wider historical and political context.
Assam's Muslims are not a monolith. They are Assamese-speaking and Bengali-speaking, riverine and hill-dwelling, indigenous and migrant, rural and urban. Their demographic story is, at its core, a story about structural deprivation - and about what happens to communities when the state fails to reach them. It is that story, not a story of religious expansion or demographic threat, that the evidence consistently supports.
Support Independent Media That Matters
nous is committed to producing bold, research-driven content that challenges dominant narratives and sparks critical thinking. Our work is powered by a small, dedicated team — and by people like you.
If you value independent storytelling and fresh perspectives, consider supporting us.
Contribute monthly or make a one-time donation.
Your support makes this work possible.